
SaaS Metrics Dashboard for QuickBooks: Track ARR, Churn, and Customer Health in Real-Time
Why Can't QuickBooks Provide SaaS Metrics Automatically?
QuickBooks Online is excellent at traditional accounting—tracking cash, managing expenses, generating financial statements, and maintaining your general ledger. But it wasn't designed for subscription business models, and it lacks the specialized calculations required for SaaS metrics.
What QuickBooks Shows vs. What SaaS Companies Need
QuickBooks provides traditional accounting metrics like revenue, expenses, profit, and cash flow. These metrics tell you what happened in the past—last month's revenue, last quarter's expenses, year-to-date profit. For established businesses with predictable revenue patterns, these backward-looking metrics are sufficient.
SaaS companies need forward-looking metrics that predict future performance. When someone asks 'What's our ARR?', they want to know the annualized value of current subscriptions—not what you billed last month. When investors ask about net revenue retention, they're evaluating whether your existing customers are expanding or contracting—a leading indicator of future growth.
The Manual Spreadsheet Problem
Most QuickBooks users try to bridge this gap with Excel. They export customer lists, pull invoice data, manually categorize subscription types, build complex formulas to calculate ARR, track churned customers in separate tabs, and maintain cohort analysis models. This process typically consumes 10-20 hours per month and is highly error-prone.
Worse, the metrics are always stale. By the time you finish your calculations, you're reporting data from last month—or even last quarter. When a board member asks about current ARR during a meeting, you can't provide an instant answer. You promise to 'pull the numbers and send them over'—knowing it will take hours of spreadsheet work.
What SaaS Metrics Should You Track and Why Do They Matter?
SaaS metrics provide visibility into business health, growth trajectory, and future performance. Here are the essential metrics every B2B SaaS company should track:
1. Annual Recurring Revenue (ARR)
ARR is the annualized value of all active subscription contracts. It's the single most important metric for B2B SaaS companies because it represents predictable, recurring revenue you can count on.
Calculation: Sum of all annual contract values for active subscriptions. For monthly contracts, multiply MRR by 12.
Why it matters: ARR is how investors value SaaS businesses (typically 5-15x ARR for healthy companies). It's also your baseline for measuring growth month over month and year over year.
Example: Company has 50 customers at $5,000/year each. ARR = $250,000. If you add 10 new customers this month, ARR grows to $300,000 (+20% growth).
2. Monthly Recurring Revenue (MRR)
MRR is the monthly value of all active subscriptions. It's particularly important for companies with monthly billing or short contract terms because it shows month-to-month momentum more clearly than ARR.
Calculation: Sum of all monthly subscription values. For annual contracts, divide by 12.
Why it matters: MRR shows month-over-month growth trends more clearly than ARR. It helps you spot accelerating or decelerating growth before it shows up in annual numbers.
3. Net Revenue Retention (NRR)
NRR measures how much revenue you retain from existing customers over time, including expansions, contractions, and churn. It's one of the most powerful predictors of long-term success. NRR above 100% means your existing customers are growing faster than you're losing revenue to churn—a clear sign of product-market fit.
Calculation: (Starting ARR + Expansion - Contraction - Churn) / Starting ARR × 100
Why it matters: Best-in-class SaaS companies have NRR of 120%+. This means even with zero new customers, revenue grows 20% annually from existing customers alone. Public SaaS companies with NRR above 130% typically trade at premium valuations.
Example: Start year with $1M ARR. Add $200K in expansions, lose $50K to downgrades, lose $100K to churn. NRR = ($1M + $200K - $50K - $100K) / $1M = 105%. You retained and grew revenue from existing customers.
4. Gross Revenue Retention (GRR)
GRR measures revenue retention without counting expansions. It shows how sticky your product is—how well you retain customers at their current spending levels before any upsells or expansions.
Calculation: (Starting ARR - Contraction - Churn) / Starting ARR × 100
Why it matters: GRR above 90% is considered healthy. GRR below 85% suggests significant product, pricing, or customer success issues that need addressing.
5. Customer Churn Rate
Churn rate measures the percentage of customers who cancel their subscriptions. This is typically measured monthly for monthly contracts and annually for annual contracts.
Calculation: (Customers Lost / Total Customers at Start of Period) × 100
Why it matters: Monthly churn above 5% or annual churn above 20% makes growth extremely difficult. You're losing customers faster than you can acquire them, creating a leaky bucket problem.
6. Customer Lifetime Value (LTV)
LTV estimates the total revenue you'll generate from a customer over their entire relationship with your company. It helps you understand how much you can afford to spend on customer acquisition.
Calculation: Average Revenue Per Customer / Churn Rate
Why it matters: LTV:CAC ratio should be 3:1 or higher. If your LTV is $30,000 and CAC is $10,000, you're generating healthy returns on acquisition investment.
7. Customer Acquisition Cost (CAC)
CAC measures how much you spend in sales and marketing to acquire one new customer. This includes salaries, advertising, tools, and all other acquisition costs.
Calculation: Total Sales & Marketing Spend / Number of New Customers Acquired
Why it matters: CAC determines profitability and scalability. If your CAC is too high relative to LTV, growth becomes expensive and unsustainable.
8. CAC Payback Period
CAC payback period measures how many months it takes to recover the cost of acquiring a customer through the gross margin they generate.
Calculation: CAC / (Monthly Recurring Revenue × Gross Margin %)
Why it matters: Payback under 12 months is healthy. Under 6 months is excellent. Long payback periods strain cash flow and limit growth velocity.
What Are Healthy SaaS Metrics Benchmarks?
Understanding where your metrics stand relative to industry benchmarks helps you identify strengths and weaknesses:
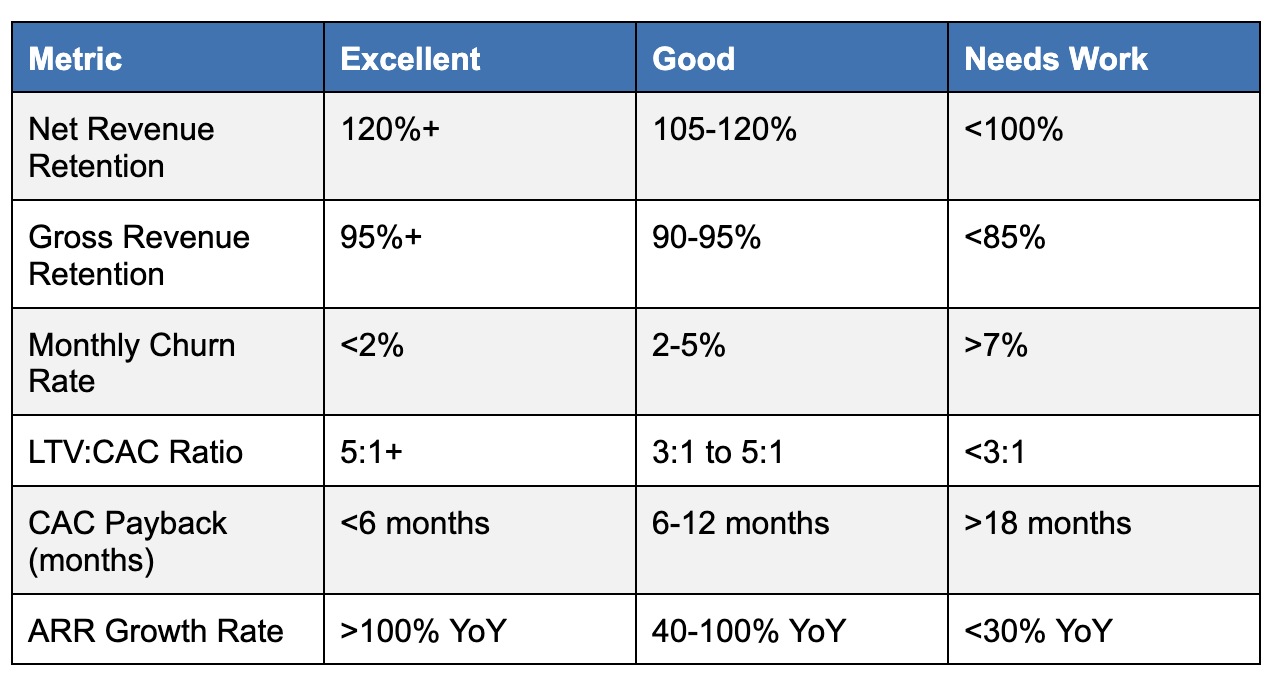
These benchmarks vary by company stage, market segment, and business model. Early-stage companies typically show higher growth but weaker retention. Enterprise SaaS usually has better retention but slower growth. Use these as guidelines, not absolute requirements.
How Does Billing Connect to SaaS Metrics?
Your SaaS metrics are only as accurate as the underlying contract and billing data. ARR, churn, and retention calculations all depend on knowing exactly which customers have active subscriptions, what they're paying, when contracts started, and when they renew or cancel.
The Data Foundation Problem
When billing lives in QuickBooks and metrics live in spreadsheets, you're constantly reconciling between systems:
- A new customer signs up but the invoice hasn't been entered yet — ARR is understated
- A customer churns but nobody updated the spreadsheet — churn is understated
- A customer upgrades mid-contract but it's tracked in email threads — expansion revenue is missed
- Renewal invoices go out late and contract dates drift — retention calculations are wrong
Every manual handoff between systems creates an opportunity for error. And errors in your metrics mean you're making strategic decisions based on wrong data.
Why Unified Billing and Metrics Matter
When your billing system and metrics dashboard are connected — or better, unified in one platform — the data stays accurate automatically:
Contract creates the invoice: When you enter a new contract, the system generates the invoice and immediately updates ARR. No manual entry, no lag.
Renewals update automatically: When a contract renews, billing goes out and ARR reflects the renewal. No spreadsheet updates required.
Churn is captured instantly: When a contract ends or is cancelled, the system stops billing and updates churn metrics in real-time. No hunting through emails to figure out who left.
Expansions and contractions flow through: When customers upgrade or downgrade, the billing change automatically updates your net revenue retention calculation.
What This Means for Your Metrics
Companies with disconnected billing and metrics systems typically have 5-15% error rates in their ARR calculations. They discover churned customers months after the fact. They miss expansion revenue because it's tracked informally. They spend hours reconciling spreadsheets instead of acting on insights.
Companies with unified billing and metrics have real-time accuracy. When the board asks "What's our ARR right now?", the answer is instant and trustworthy. When investors ask about net retention, you pull up the dashboard — not a spreadsheet you hope is current.
What Is the Best SaaS Metrics Dashboard for QuickBooks?
Most SaaS metrics tools are designed for enterprise companies using Salesforce and NetSuite. They assume you have a data team to configure dashboards and maintain integrations. For mid-market SaaS companies on QuickBooks, the options are more limited — but one stands out.
TrueRev: Built for QuickBooks SaaS Companies
TrueRev provides a complete SaaS metrics dashboard that connects natively to QuickBooks Online. But unlike standalone analytics tools, TrueRev also handles the billing and revenue recognition that feeds those metrics — so your data is always accurate and current.
Why TrueRev works for QuickBooks users:
- Native QuickBooks integration: One-click connection syncs customers, invoices, and revenue data automatically. No CSV exports, no manual data entry, no broken integrations.
- Real-time ARR/MRR: See your current recurring revenue instantly, broken down by customer, product, cohort, or time period. Updated automatically as contracts and invoices flow through.
- Net revenue retention tracking: Automatic calculation of NRR, GRR, expansion, contraction, and churn. See trends over time without building spreadsheet models.
- Customer-level visibility: Drill down to individual customers to see contract history, revenue trajectory, and health indicators. Identify at-risk accounts before they churn.
- ARR roll-forward reporting: Board-ready reports showing how ARR changed period over period — new business, expansion, contraction, and churn broken out clearly.
- Unified with billing and revenue: Your metrics are only as good as your data. TrueRev handles contract management, billing automation, and revenue recognition in the same system — so metrics are always accurate.
- Implementation in days: Connect QuickBooks, configure your products, import contracts, and your dashboard is live. No six-month implementation projects.
- Transparent pricing: $3,000 per year with all features included. No per-user fees, no revenue-based pricing that scales up as you grow.
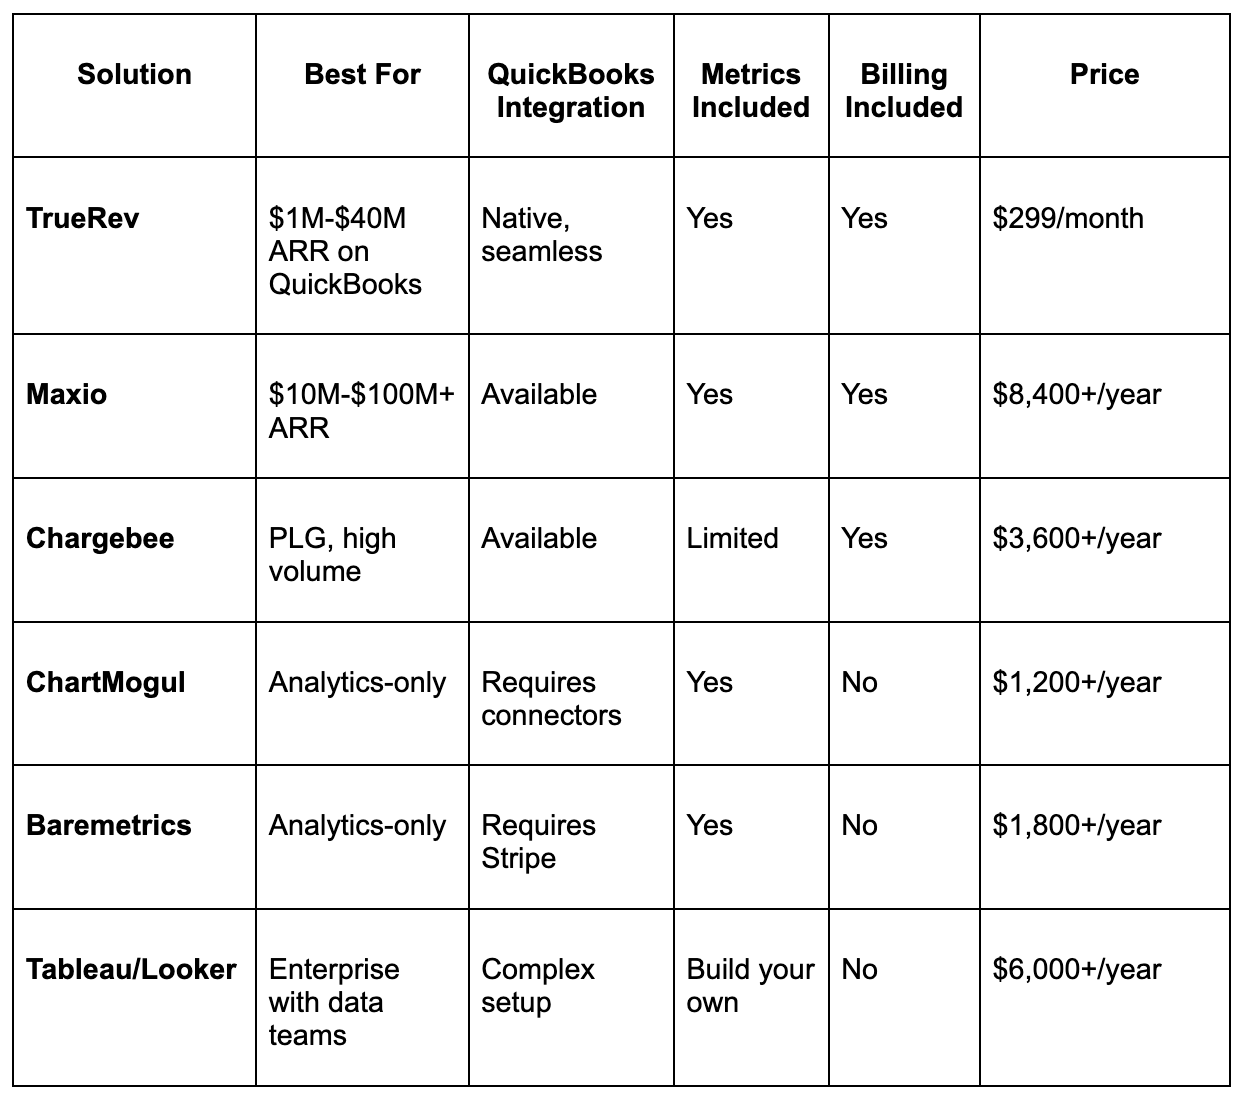
Maxio provides comprehensive billing and metrics but is designed for larger companies with complex needs. Implementation takes months, pricing scales with revenue, and it's overkill for most QuickBooks users.
Chargebee focuses on billing and checkout optimization. Metrics are available but secondary to their core billing functionality. Better fit for product-led growth companies than B2B SaaS.
ChartMogul and Baremetrics are analytics-only tools. They can calculate SaaS metrics but don't handle billing or revenue recognition. You still need separate systems for invoicing and rev rec, which creates the data accuracy problems discussed above.
Tableau and Looker are powerful BI platforms but require significant configuration, data modeling expertise, and ongoing maintenance. They make sense for companies with dedicated data teams — not lean finance operations.
For QuickBooks users who need accurate SaaS metrics without enterprise complexity, TrueRev provides the complete solution: billing automation, revenue recognition, and real-time metrics in one unified platform.
How Can You Get Real-Time SaaS Metrics from QuickBooks?
You have three options for tracking SaaS metrics with QuickBooks, each with different trade-offs:
Option 1: Manual Spreadsheet Models (Not Recommended)
Manual Excel-based tracking involves exporting customer data from QuickBooks, categorizing subscription types, building formulas to calculate each metric, tracking customer status changes manually, and maintaining historical trends. This approach consumes 10-20 hours monthly, produces metrics that are always at least one month stale, is highly prone to formula errors and data inconsistencies, and breaks down as customer count grows beyond 50-100.
Option 2: Business Intelligence Tools (Complex Setup)
Tools like Tableau, Looker, or Metabase can connect to QuickBooks and calculate SaaS metrics. However, they require significant configuration: data modeling expertise, custom metric definitions, ongoing maintenance as your business changes, and typically cost $500-$2,000 monthly. These tools work well for companies with dedicated data analysts but are overkill for mid-market SaaS companies.
Option 3: Purpose-Built SaaS Metrics Dashboards
Specialized software connects to QuickBooks and automatically calculates SaaS metrics without manual work or complex configuration. These tools understand SaaS business models and provide pre-built dashboards for common metrics.
TrueRev for QuickBooks:
- Native QuickBooks Online integration
- Real-time ARR/MRR calculation
- Net revenue retention tracking
- Customer-level detail and cohort analysis
- Revenue waterfall visualization
- Churn and retention metrics
- Implementation in days, not months
- Pricing: $3,000/year, all features included
Frequently Asked Questions
Can QuickBooks calculate ARR automatically?
No. QuickBooks tracks revenue and invoices but doesn't understand subscription contracts or recurring revenue patterns. To get ARR, you need to either manually calculate it from QuickBooks data or use specialized SaaS metrics software that connects to QuickBooks.
How do investors use SaaS metrics?
Investors evaluate SaaS companies primarily through metrics like ARR growth rate, net revenue retention, CAC payback period, and LTV:CAC ratio. These metrics help investors assess growth trajectory, capital efficiency, product-market fit, and business sustainability. Companies with strong metrics command higher valuations and easier fundraising.
What's the difference between ARR and revenue?
Revenue in QuickBooks reflects actual cash collected or billed. ARR represents the annualized value of active subscriptions—a forward-looking metric. You might have $200K revenue this quarter but $1M ARR if you have annual contracts that will recognize revenue over time. ARR is more predictable and stable than quarterly revenue.
Do I need different metrics for different business models?
Core metrics like ARR, churn, and retention apply to all SaaS companies. However, emphasis varies by model. PLG companies focus more on activation and conversion metrics. Enterprise SaaS emphasizes sales efficiency and expansion. Usage-based billing requires consumption tracking. The fundamentals remain consistent across models.
Ready to Track Your SaaS Metrics in Real-Time?
QuickBooks provides excellent basic accounting but lacks the specialized calculations SaaS companies need for strategic decision-making. Manual spreadsheet processes are time-consuming, error-prone, and don't scale.
For B2B SaaS companies on QuickBooks, a dedicated SaaS metrics dashboard provides instant visibility into ARR, retention, churn, and customer health—without complex spreadsheets or expensive enterprise software. TrueRev offers purpose-built metrics tracking that integrates directly with QuickBooks, implements in days, and costs $3,000 per year.
Want to see a demo?
we offer a 14-day free trial.